In the digital age, consumers expect clear, engaging, and visually appealing content, especially when making significant purchases like vehicles. Infographics are a powerful tool for automotive marketers to present key information about a vehicle in a concise and visually attractive way. By combining data, images, and text, infographics can effectively highlight a vehicle’s standout features, performance metrics, and unique selling points. Here’s how to use infographics to showcase vehicle features and make your marketing more impactful.
1. Highlight Key Features in with Visual Icons
One of the primary advantages of using infographics is the ability to distill complex information into easily digestible visuals. When showcasing vehicle features, icons can be used to represent specific attributes like fuel efficiency, horsepower, safety features, or technology integrations.
For example, a fuel pump icon can represent fuel efficiency, a steering wheel for advanced handling, or a shield for safety features. These simple visual cues help potential buyers quickly grasp what the vehicle offers without needing to read through dense text.
Pro Tip: Keep the icons simple and consistent in style to maintain a clean and professional look. Use bold colors to make these icons pop against the background, drawing attention to the most critical features.
2. Break Down Performance Metrics
Vehicle performance data, such as horsepower, torque, or fuel economy, can be difficult for the average buyer to fully understand. Infographics allow you to simplify this information by using charts, graphs, or comparison tables that make the numbers easy to interpret.
For instance, a bar graph comparing the fuel efficiency of the car you’re showcasing with its competitors can visually demonstrate the car’s superiority. Similarly, a pie chart breaking down the percentage of fuel savings with a hybrid model makes the benefits more relatable.
Pro Tip: Use comparison charts sparingly and ensure they provide meaningful insights. Always maintain clarity—overloading an infographic with too much data can overwhelm the viewer.
3. Visualize Technology and Safety Features
Cars today come with a range of advanced technology and safety features, from lane-keeping assist to built-in navigation systems. However, explaining these features in plain text can often feel dry or overwhelming for the consumer. Infographics provide an excellent opportunity to illustrate how these features work.
You can use a step-by-step visual guide to show how a lane departure warning system alerts the driver or create a visual flow that explains how a car’s collision prevention system operates in real-time. This makes the technical aspects of the vehicle more understandable, increasing the perceived value of the car.
Pro Tip: Use illustrations or diagrams to explain how technology functions, and ensure the design aligns with the brand’s tone—modern and sleek for tech-heavy models, for example.
4. Show Off the Interior and Exterior Design
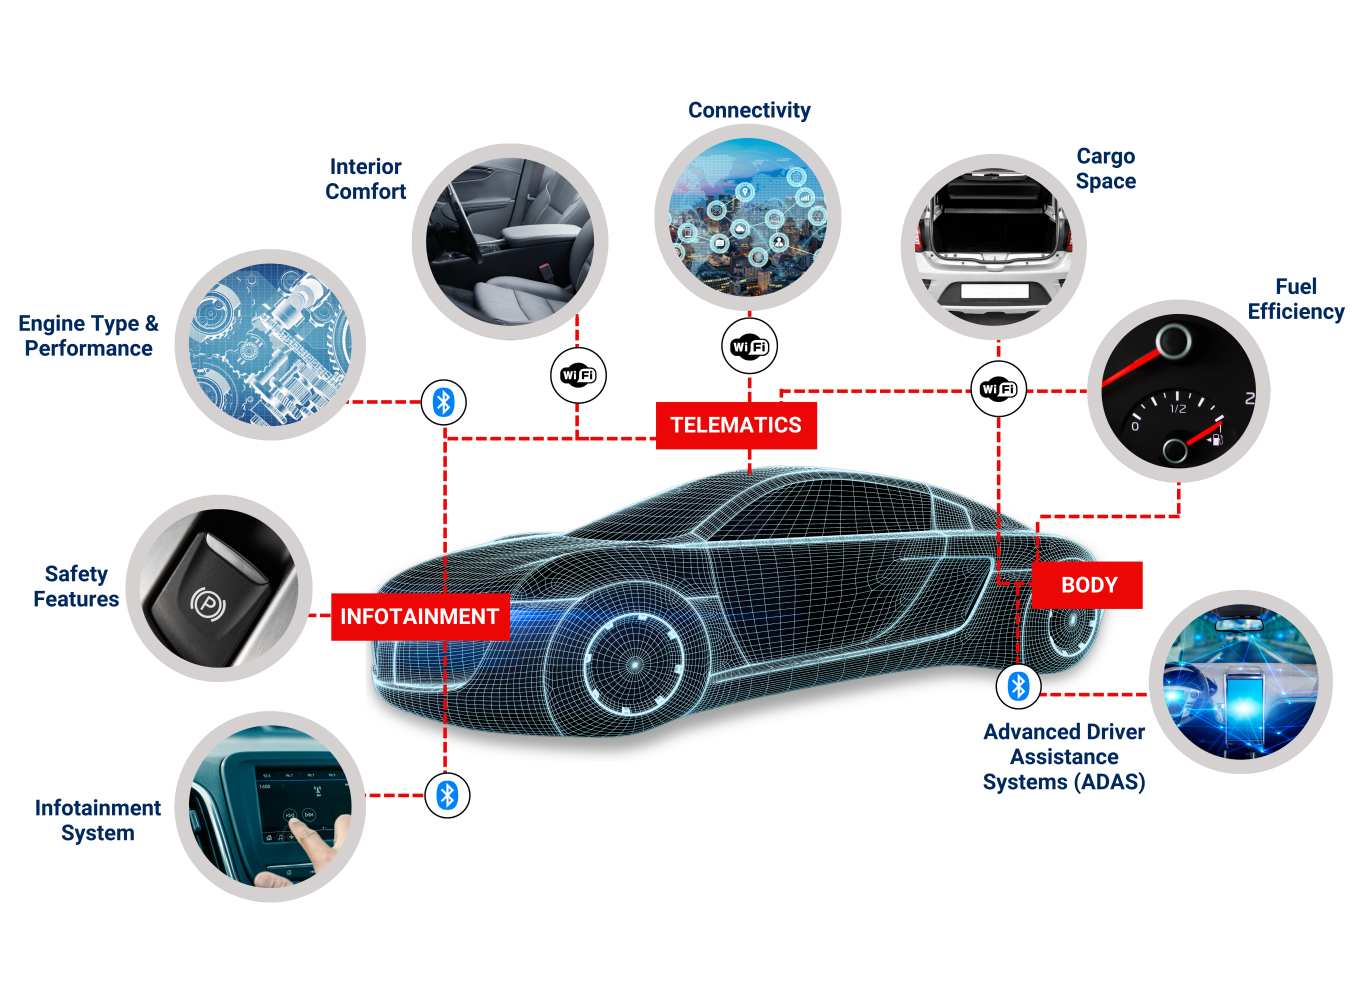
A car’s design, both inside and out, plays a huge role in a buyer’s decision. Infographics can be used to break down the key elements of a vehicle’s design, such as the ergonomic dashboard layout, luxurious seating materials, or aerodynamic body lines.
You can create an infographic that highlights different sections of the car, labeling the features that set the design apart—like LED headlights, panoramic sunroof, or leather upholstery. A clear diagram of the vehicle, overlaid with text boxes pointing to each unique design element, helps buyers understand the car’s craftsmanship and functionality at a glance.
Pro Tip: Use high-quality images of the vehicle in your infographic. This ensures the design features are accurately represented and look appealing to potential buyers.
5. Create Step-by-Step Buying Guides or Feature Walkthroughs
Infographics aren’t just great for showing off vehicle specs—they’re also perfect for walking potential buyers through the car-buying process or explaining how to use the car’s features. Creating a step-by-step guide, complete with visuals, can simplify the decision-making process for buyers.
For instance, you could create an infographic detailing “How to Choose the Right SUV,” guiding buyers through key considerations like cargo space, fuel efficiency, and off-road capabilities. Or, for existing owners, you could design a “How to Use the Infotainment System” infographic that outlines the steps for setting up Bluetooth or using voice commands.
Pro Tip: Make sure the steps are clear and actionable, and use arrows or numbers to guide the reader through the process visually. These types of infographics can increase engagement and improve the buyer’s overall experience with the vehicle.
6. Compare Models Side by Side
When buyers are choosing a car, they’re often comparing different models. Infographics make it easy to lay out side-by-side comparisons of similar vehicles. You can create a visual chart that highlights how your car stacks up against competitors in terms of features, price, fuel efficiency, or safety ratings.
This type of infographic makes the decision-making process easier for buyers by presenting all the critical information in one place. It’s also a great tool for demonstrating why your vehicle is the better choice, especially if you can show a clear advantage in key areas like performance or technology.
Pro Tip: Focus on the most important attributes that buyers care about, such as pricing, features, and fuel efficiency. Ensure the comparison is objective and easy to understand, with key differentiators highlighted clearly.
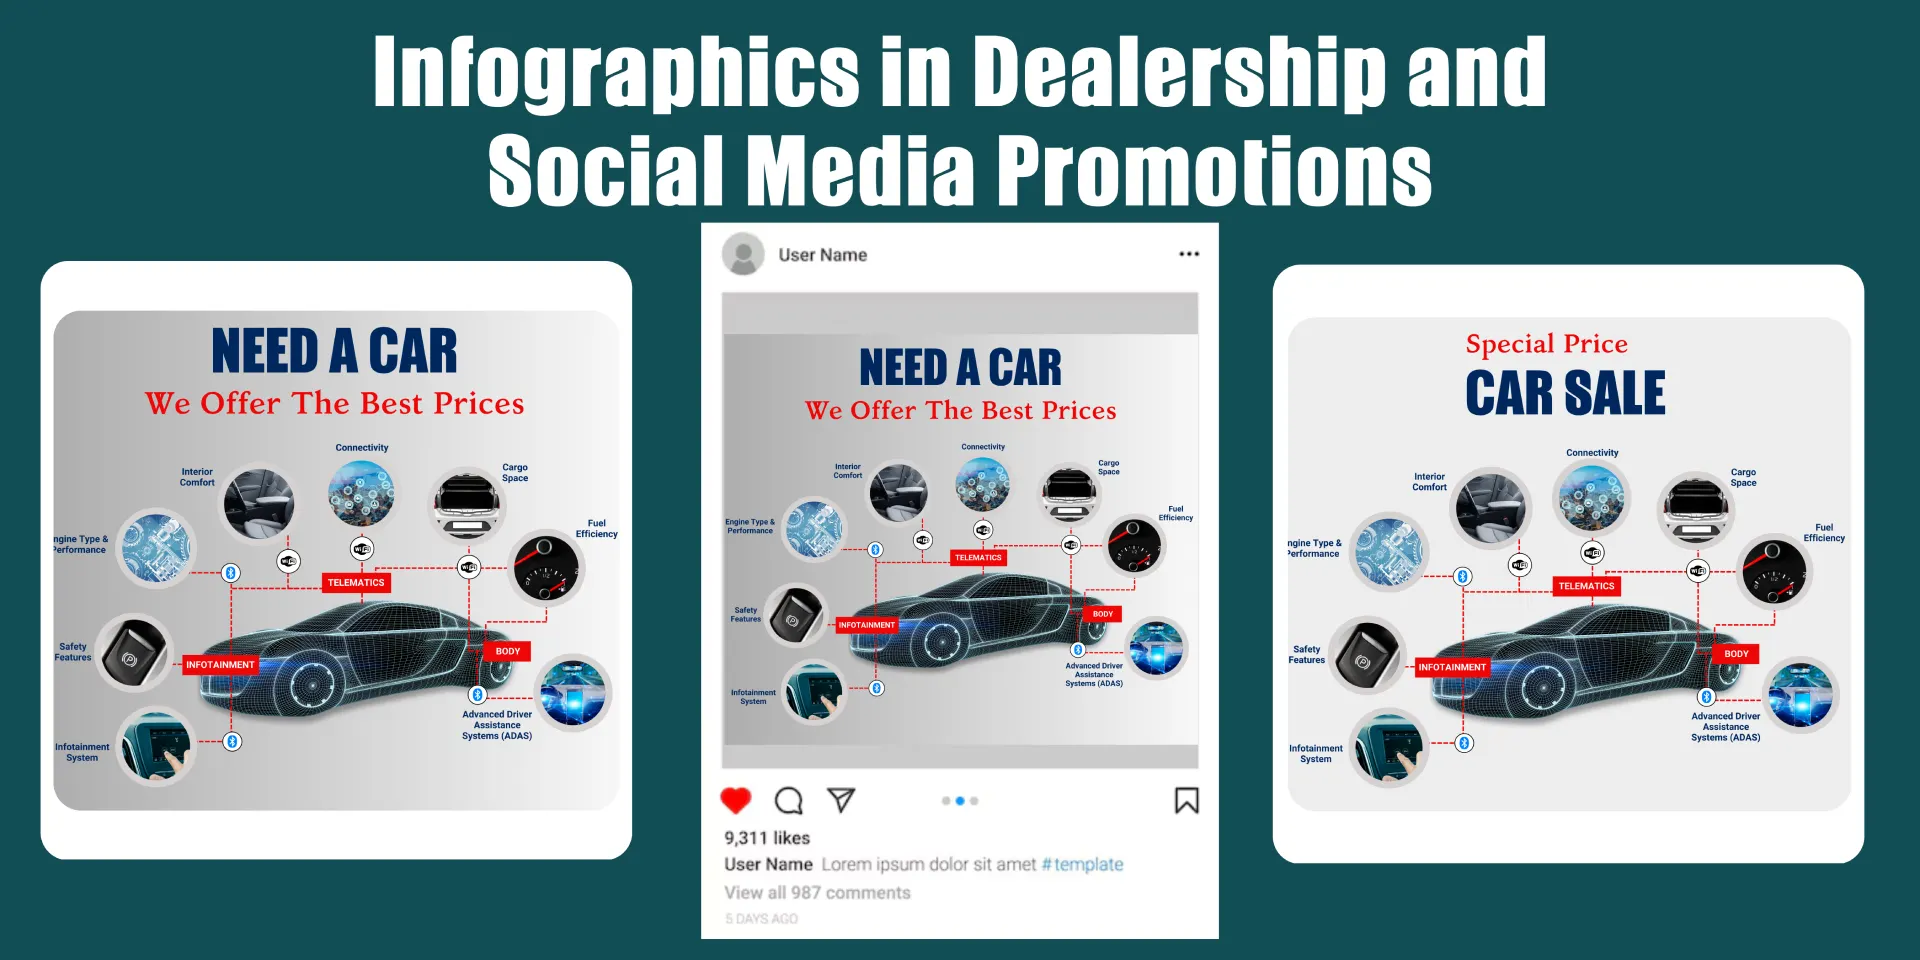
7. Use Infographics in Dealership and Social Media Promotions
Infographics are not just great for websites—they can be powerful tools for social media and in-dealership promotions as well. Car dealerships can use infographic posters in their showrooms to highlight a vehicle’s standout features, making it easier for potential buyers to engage with the information.
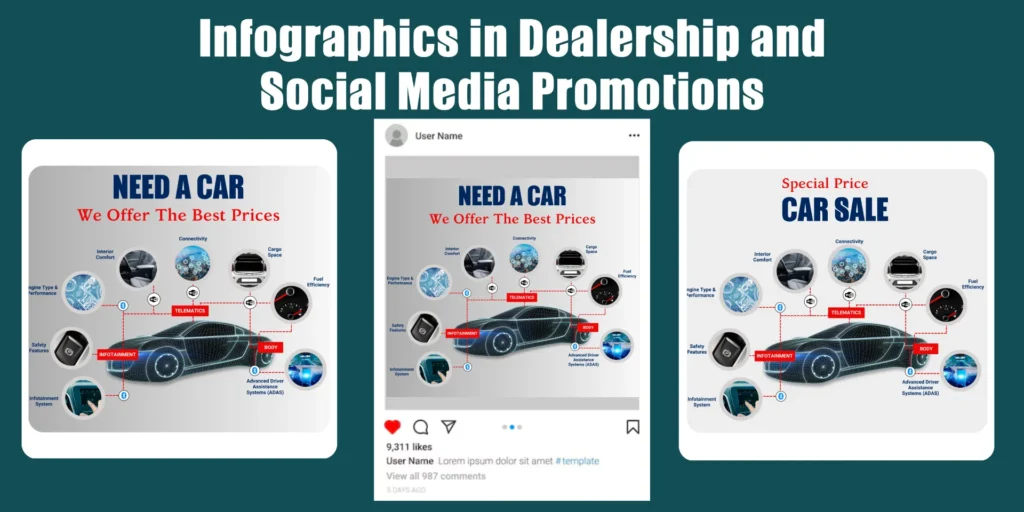
On social media platforms like Instagram, Facebook, and Pinterest, infographics can be shared as part of promotional campaigns. These posts tend to receive high engagement because they are visually appealing and offer valuable, concise information.
Pro Tip: Design your infographics with mobile users in mind, ensuring they are easy to read and interact with on smaller screens. Keep the information short and punchy, focusing on just a few key points.
8. Build Trust with Data-Backed Infographics
Buyers trust vehicles that come with data to back up their claims. You can use infographics to showcase vehicle awards, reliability ratings, safety scores, or customer satisfaction metrics. By displaying this data in a clear, visual format, you not only communicate the car’s quality but also build trust with your audience.
For example, you can create an infographic that highlights a vehicle’s top safety rating, breaking down the specific safety features that contributed to this score, like airbags, collision detection, and automatic braking. This not only informs buyers but also reassures them of the car’s reliability.
Pro Tip: Make sure to use accurate and up-to-date data from reputable sources. Citing awards or third-party endorsements in your infographic adds credibility to your vehicle’s claims.
Conclusion
Infographics are a highly effective way to showcase vehicle features in a clear, engaging, and visually appealing format. Whether you’re highlighting performance metrics, illustrating safety features, or comparing different models, infographics help simplify complex information and present it in a way that resonates with buyers.
Incorporating well-designed infographics into your automotive marketing strategy not only enhances customer engagement but also makes it easier for potential buyers to understand the value of your vehicles. From social media posts to dealership materials, infographics can help you communicate key vehicle features and boost your sales efforts.